


Senator James Inhofe
Mr. President, after today’s vote on President Obama’s failed infrastructure plan, I urge my colleagues to turn their attention now to a bill that is proven to create jobs and give our economy a much-needed boost. Of course, I’m talking about the bipartisan highway bill that I am sponsoring with my good friends, Senators Boxer, Vitter and Baucus. Most people are amazed at how close Senator Boxer and I are on this issue.
While I appreciate President Obama’s acknowledgement that infrastructure spending is highly effective at spurring job growth, it is clear that his plan was all show with no substance. His bill was purely a political opportunity: it gave him a chance to stand in front of a bridge and make a speech about creating jobs, knowing full well that his bill would never pass.
The problem is that President Obama has been talking the talk without walking the walk. He has spoken more about infrastructure than any other President since Eisenhower proposed the interstate system, but he has done substantially less than any other President. The most notable example is the “no-stimulus” bill that allocated less than 3% to fund roads and bridges, while a majority of the funds went to wasteful spending, which clearly failed to stimulate the economy. He has made the entire process political and that has been a significant obstacle to getting our highway bill done.
The good news is that today’s votes, on both the Democrat and Republican infrastructure bills, showed that there is a strong bipartisan majority in the Senate that supports creating jobs and strengthening our economy by rebuilding our crumbling roads and bridges. Fortunately, Senator Boxer and I are about to unveil our highway bill, which will do just that. I would like to commend Senator Boxer for her leadership and dedication to this effort. Together, with Senators Baucus and Vitter, we have put together a good bill, which makes a number of important policy reforms and maintains the current level of funding.
As both parties are trying to create jobs and spur economic growth through building highways and bridges, most Americans are unaware of just how damaging excessive regulations are to our economy.
The EPA alone has an unprecedented number of rules that are destroying jobs and decreasing federal revenue. Five of the most expensive ones stand out. They are:
1) Greenhouse Gas Regulations - $300 to $400 Billion in lost GDP per year
2) Ozone National Ambient Air Quality Standards -$676.8 billion in lost GDP by 2020
3) Boiler Maximum Achievable Control Technology (MACT) - $1 Billion in lost GDP
4) Utility MACT - $184 Billion in compliance costs between 2011 and 2030
5) Cement MACT - $3.5 Billion in compliance costs
Fortunately, in September, President Obama withdrew EPA’s proposed toughened ozone standards. With an election coming up, he clearly did not want to be responsible for the enormous cost, or the 7 million jobs that would be destroyed by this rule. But the fight isn’t over yet. He is punting on a number of these regulations until after the election.
Even Democrats have gone on record warning of the high costs of regulating carbon. During the cap-and-trade debate, the Democrats’ mantra was that greenhouse gas regulations would be far worse than cap-and-trade legislation. As EPA Administrator Lisa Jackson explained, “I have said over and over, as has the president, that we do understand that there are costs to the economy of addressing global warming emissions, and that the best way to address them is through a gradual move to a market-based program like cap and trade.” And as Senator Kerry warned in a New York Times Op Ed, “If Congress does not pass legislation dealing with climate change, the administration will use the Environmental Protection Agency to impose new regulations. Imposed regulations are likely to be tougher and they certainly will not include the job protections and investment incentives we are proposing.”
Even worse, EPA will need to hire 230,000 additional employees and spend an additional $21 billion to implement its greenhouse gas regime. And all of this economic pain is for nothing: as EPA Administrator Jackson also admitted before the EPW committee, these regulations will have no affect on the climate.
Now it has become clear that this entire effort is built on a faulty foundation. In April 2010, I asked the EPA Office of Inspector General (OIG) to investigate the process leading up to the endangerment finding to determine if EPA had come to that conclusion properly. Of course, the endangerment finding is the basis of EPA’s decision to regulate greenhouse gases. In September 2011, the OIG completed its report and found that the EPA had not come this conclusion properly - in fact, it found that the scientific assessment underpinning the Obama EPA’s endangerment finding for greenhouse gasses was inadequate and in violation of the Agency’s own peer review process.
The Inspector General’s investigation uncovered that EPA failed to engage in the required record-keeping process leading up to the endangerment finding decision, and it also did not follow its own peer review procedures to ensure that the science behind the decision was sound. EPA Administrator Lisa Jackson readily admitted in 2009 that EPA had outsourced its scientific review to the United Nations’ Intergovernmental Panel on Climate Change (IPCC). This is an institution whose credibility has already been called into question. Even so, EPA still refused to conduct its own independent review of the science. As the EPA Inspector General found, whatever one thinks of the UN science, the EPA is still required - by its own procedures - to conduct an independent review.
This report confirms that the endangerment finding, the very foundation of President Obama’s job-destroying regulatory agenda, was rushed, biased, and flawed. It calls the scientific integrity of EPA’s decision-making process into question and undermines the credibility of the endangerment finding.
This is not the only example of EPA cutting corners on the process. In the wake of the IG report, it now appears that EPA has cut corners on the proposed Utility MACT rule as well. My EPW committee staff has found that the peer review procedures for the Utility MACT Technical Support Documents are inadequate. Indeed, EPA’s own Science Advisory Board criticized the Agency for “missing or poorly explained” data and methods. Given the cost and reliability effects of the proposed rule, it is critical that EPA be held accountable for the process leading up to the decision to regulate. Utility MACT is projected to be one of the most expensive rules in the Agency’s history. It will cost billions of dollars, significantly increase electricity rates, force a large number of plant closures, and, along with the Cross-State rule, destroy nearly 1.4 million jobs. Cutting corners on a rule with such devastating effects on our economy is unacceptable.
I have asked EPA to answer some important questions on this matter and if that information is not forthcoming, I will request that the EPA IG conduct an investigation of the Utility MACT rulemaking process as well.
My concerns about EPA cutting corners were only exacerbated today as the Agency finalized the scope of its plan to study hydraulic fracturing. When EPA first announced that it would be conducting this study, I said that in order for it to be credible, it must be based on the best available science, and follow a legitimate, objective peer-review process, as well as rely on data and expertise from state oil and gas regulatory agencies, and independent groups such as the Ground Water Protection Council.
EPA has failed to follow these reasonable guidelines. In fact, even before the scope of the study was finalized today, EPA was already collecting data samples at undisclosed fracking sites across the country. Because these samples were obtained without adhering to a publicly available final study plan or testing procedures, the validity of this data is called into question. EPA should not have begun conducting the study without ensuring that the process is fully transparent, and in accordance with sound science.
Let’s keep in mind that a Congressional Research Service (CRS) report shows us that we have enough natural gas to meet American demand for 90 years; but we can’t get to those vast resources without hydraulic fracturing. The first use of hydraulic fracturing occurred near Duncan, Oklahoma in 1949. It has been regulated by states and used efficiently for decades, while playing an important role in strengthening America’s energy security and creating millions of good-paying jobs. We should be expanding, rather than hindering this development, especially when we most need to spur economic growth.
Mr. President, it’s time to end the political theater in Washington and finally do our job to help Americans get back to work. It’s time for this administration to reverse course on overregulation and work with us to pass a realistic bipartisan highway bill that will help get our economy back on track. Let’s do the right thing.
Back in 2007, the environMENTAL activist group, the Union of Concerned Scientists participated at Mt. Washington in a propoganda conference for the Ski, Forest, Recreation and Maple Industries. They predicted accelerating global warming that would result in shorter, warmer winters, much less snow and a retreat of the prize sugar maple trees to Canada. they advised the ski, maple sugar and recreation industries that their livelihoods were in jeopardy.
That winter that followed saw all-time record snows and the best ski season in history, it was surpassed in 2009/10 and 2010/11 with even more snow in places even well south of northern New England. The last decade has seen winter temperatures in the northeast decline 2.10F. Now a story out of Duke University says that the tree migration is another fail for UCS and their tinker toy models.
Forests stay put, defy alarmists
Posted on October 31, 2011 by Steve Milloy
It’s fall, but the trees aren’t leaving. Maybe that’s because the treehuggers are holding too tight?
From a Duke University media release:
DURHAM, N.C. - More than half of eastern U.S. tree species examined in a massive new Duke University-led study aren’t adapting to climate change as quickly or consistently as predicted.
“Many models have suggested that trees will migrate rapidly to higher latitudes and elevations in response to warming temperatures, but evidence for a consistent, climate-driven northward migration is essentially absent in this large analysis,” says James S. Clark, H.L. Blomquist Professor of Environment at Duke’s Nicholas School of the Environment.
Nearly 59 percent of the species examined by Clark and his colleagues showed signs that their geographic ranges are contracting from both the north and south.
Fewer species - only about 21 percent - appeared to be shifting northward as predicted. About 16 percent seemed to be advancing southward, and around 4 percent appeared to be expanding in both directions.
The scientists analyzed data on 92 species in more than 43,000 forest plots in 31 states. They published their findings this month in the journal Global Change Biology.
The study found no consistent evidence that population spread is greatest in areas where climate has changed the most; nor do the species’ response patterns appear to be related to seed size or dispersal characteristics.
“Warm zones have shifted northward by up to 100 kilometers in some parts of the eastern United States, but our results do not inspire confidence that tree populations are tracking those changes, says Clark, who also holds appointments at Duke as a professor of biology and statistics. “This increases the risk of serious lags in tree migrations.”
The concept of climate-driven migration is based on the assumption that as temperatures warm, the southern edge of some tree species’ ranges could begin to erode as adult trees die and the seeds they leave behind in the soil can no longer sprout. At the same time, the species could spread to higher latitudes as seedlings dispersed on their northern boundaries are able to take root in newly favorable climates there.
To test whether this predicted response was occurring in real life, Clark and his colleagues pored through decades of data compiled by the U.S. Forest Service’s Forest Inventory and Analysis Program. They compared the relative distributions of seedlings, saplings and adult trees of 92 widely distributed eastern U.S. species at 43,334 plots in 30 different longitudinal bands, and factored in things like seed characteristics, and changes in climate and precipitation.
“The patterns of tree responses we were able to document using this seedling-versus-tree analysis are more consistent with range contraction than with northward migration, although there are signs some species are shifting to higher elevations,” Clark says.
The fact that the majority of the northernmost latitudes documented for seedlings was lower than those for adult trees of the same species indicates “a lack of evidence for climate-mediated migration, and should increase concern for the risks posed by climate change,” he says.
Also this report:
Old snow stays in Rockies, adds to glaciers’ size - Boston.com
Snow is already piling up in the high country, but not all of the unusually deep snow from last winter has melted. As a result, some glaciers and snowfields are actually gaining volume this year.
Scientists have measured new ice in Montana’s Glacier National Park and atop Colorado’s Front Range mountains. In northwest Wyoming, there is photographic evidence of snowfield growth after Bob Comey, director of the Bridger-Teton National Forest Avalanche Center, compared photos of peaks from year to year.
His images taken before snow started falling again this autumn show what appears to be significantly more ice in the Teton Range compared with two years ago.
Last spring, record snow depths and avalanches around Jackson Hole gave way to concern about possible flooding, but fairly cool weather kept much of the snow right where it was. The flooding that did occur, at least in Wyoming, was less severe than feared.
“I’ve never seen a season with a gain like we’ve seen this summer,” Comey said.
by Dr. Tim Ball on October 28, 2011
Anyone who knows anything about global climate knows the Earth has generally warmed since the 1680s. Politics has made that period, which covers the Industrial Revolution, of climatic interest as people wanted to prove that human production of CO2 was causing warming. The problem, ignored by proponents, is that it has warmed naturally since the nadir of the Little Ice Age in the 1680s. The issue isn’t the warming, but the cause.
The Berkeley Earth Surface Temperature (BEST) says,
“Our aim is to resolve current criticism of the former temperature analyses, and to prepare an open record that will allow rapid response to further criticism or suggestions.”
Their actions and results completely belie this claim and all appear to point to a political motive. The entire handling of their work has been a disaster. It is not possible to say it was planned but it has completely distorted the stated purpose and results of their work. The actions are almost too naive to believe they were accidental, especially considering the people involved in the process. Releasing reports to mainstream media before all studies and reports are complete is unconscionable from a scientific perspective. They replicate the deceptive practice of the Intergovernmental Panel on Climate Change (IPCC) of releasing the Summary for Policymakers (SPM) before the Scientific Basis Reports with which it differs considerably.
Like the IPCC, the BEST panel appears deliberately selected to achieve a result or at least ensure a bias. It begins with the leader Richard Muller, who has historically supported the anthropogenic global warming (AGW) hypothesis. There is only one climatologist, Judith Curry, who only recently shifted from a very vigorous pro AGW position to a more central and conciliatory position indicating awareness of the political implications. Involvement in the BEST debacle and especially her admission that early release of some results before the peer-reviewed articles and supporting documentation, in other words the IPCC approach, was at her suggestion is troubling. Ms. Curry’s comments indicate a very peripheral involvement in the entire process. This appears to suggest her participation was for public relations. This is supported by her admission that she was not involved in the data portion of the work.
“I have not had “hands-on” the data.”
Failure to include a skeptical climatologist appears to confirm the political objective.
Climate is the average of the weather so it is inherently statistical. I am not a statistician, but whenever statistical analysis was required I sought professional advice. I watched the discipline change from simple analysis of the average condition at a location or in a region to a growing interest in the change over time. My experience with climate statistics taught me that the greater and more detailed the statistical analysis applied the more it underscores the inadequacies of the original data. It increasingly becomes an exercise in squeezing something out of nothing. The instrumental record is so replete with limitations, errors, and manipulations that it is not even a crude estimate of the pattern of weather and its changes over time. This is confirmed by the failure of all predictions, forecasts, or scenarios from computer models built on that database.
Problems start with the assumption that the instrumental measures of global temperature can produce any meaningful results. They cannot! Coverage is totally inadequate in space and time to produce even a reasonable sample. The map (Figure 1) shows the pattern of Global Historical Climate Network (GHCN) stations from the BEST Report. It distorts the real situation. Each dot represents a single station but in scale probably covers over 500 Sq. km. They also don’t show the paucity of stations in Antarctica, most of the Arctic Basin, the deserts, the rain-forests, the boreal forest, and the mountains. Of course none of these equal the paucity over the oceans that cover 70 percent of the world. It’s bigger problem in the Southern Hemisphere, which is 80 percent water.
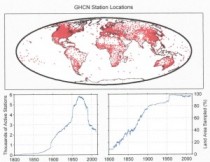
Figure 1. Area coverage of GHCN stations. Diagram from the BEST Report
BEST also shows the reduction in the number of stations after 1960. A major reason for the reduction was the assumption that satellites would provide a better record, but but BEST didn’t consider that record. It appears the main objective is to offset Ross McKitrick’s evidence that much of the warming in the 1990s was due to a reduction in the number of stations (Figure 2).
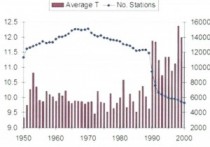
Figure 2. Ross McKitrick’s plot of global temperature against # of stations
It is presented as a “Surface” temperature record but it isn’t. It’s the temperature in a Stevenson Screen (Figure 3), which is set according to the World Meteorological Organization (WMO) between 1.25 m (4 ft 1 in) and 2 m (6 ft 7 in) above the ground. The difference is significant because temperatures in the lower few meters vary considerably as research has shows. The 0.75 m difference means that you are not comparing the same temperatures.
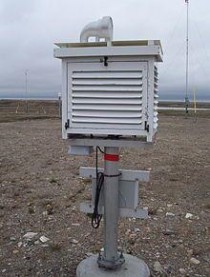
Figure 3. Stevenson Screen
Temperatures, sometimes to four decimal places, are thrown around as if they are real, measured, numbers. All temperatures are recorded to half a degree because until thermocouple thermometers appeared any greater precision was impossible.
Most of the land data is concentrated in western Europe and eastern North America so these latitudes dramatically overrepresent the record. This is important because climate change is reflected most in these latitudes as the Circumpolar vortex shifts between Zonal and Meridional flow and the amplitude of the Rossby Waves vary.
BEST used a subset of global temperatures, albeit a larger subset than anyone else however, because the full data set is inadequate, a bigger subset does not improve the analysis potential. Also those who used smaller subsets did so to create a result to support a hypothesis. The BEST study apparently was designed to confirm the results and negate the criticisms
Regardless of the BEST findings the other 3 agencies did achieve different results using by the stations they chose and they are significant. For example, one year there was a difference of 0.4C between their global annual averages, which doesn’t sound like much, but consider this against the claim that a 0.7C increase in temperature over the last approximately 130 years. What people generally ignore, is that in the IPCC estimate of global temperature increase produced by Phil Jones of 0.6C the error factor was ±0.2C. An illustration of how meaningless the record and the results are is given by the fact that in many years the difference in global annual average temperature is at least half the 0.7C figure. In summation, all 4 groups selected subsets, but even if they had used the entire data set they could not have achieved meaningful or significant results.
The use of the phrase “raw temperature data” is misleading. What all groups mean by the phrase is the data provided to a central agency by individual nations. Under the auspices of the World Meteorological Organization (WM0) each nation is responsible for establishing and maintaining weather stations of different categories. The data these stations record is the true raw data. However, it is then adjusted by the individual national agencies before it is submitted to the central record. They didn’t use “all” stations or “all” data from each station. However, it appears there were some limitations of the data that they didn’t consider, as the following quote indicates. Here is a comment in the preface to the Canadian climate normals 1951 to 1980 published by Environment Canada.
“No hourly data exists in the digital archive before 1953, the averages appearing in this volume have been derived from all available ‘hourly’ observations, at the selected hours, for the period 1953 to 1980, inclusive. The reader should note that many stations have fewer than the 28 years of record in the complete averaging.”
BEST adjusted the data, but they are only as valid as the original data. For example, the ‘official’ raw data for New Zealand is produced by NIWA and they ‘adjusted’ the “raw’ data. The difference is shown in Figure 4. Which set did BEST use? Most nations have done similar adjustments.
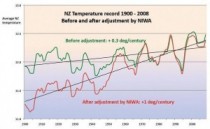
Figure 4. Temperature record adjustments for New Zealand
They failed to explain how much temperature changes naturally or whether their results are within that range. The original purpose of thirty-year ‘normals’ was to put a statistically significant sample in a context. It appears they began with a mindset that created these problems and it has seriously tainted their work. For example, they say,
“Berkeley Earth Surface Temperature aims to contribute to a clearer understanding of global warming based on a more extensive and rigorous analysis of available historical data.”
This terminology indicates prejudgement. Why global warming? It doesn’t even accommodate the shift to “climate change” forced on proponents of anthropogenic global warming (AGW) as the facts didn’t fit the theory. Why not just refer to temperature trends?
The project indicates lack of knowledge or understanding of inadequacies of the data set in space or time or subsequent changes and adjustments. Lamb spoke to the problem when he established the Climatic Research Unit (CRU). On page 203 of his autobiography he said,
“When the Climatic Research Unit was founded, it was clear that the first and greatest need was to establish the facts of the past record of the natural climate in times before any side effects of human activities could well be important.”
BEST confirms Lamb’s concerns. The failure to understand the complete inadequacy of the existing temperature record is troubling. It appears to confirm that there is an incompetence or a political motive, or both.
By George Pell, The Australian
SCIENCE and technology have already achieved considerable mastery over nature, and massive local achievements. But where is the borderline separating us from what is beyond human power?
Where does scientific striving become uneconomic, immoral or ineffectual and so lapse into hubris? Have scientists been co-opted on to a bigger, better-advertised and more expensive bandwagon than the millennium bug fiasco?
We can only attempt to identify the causes of climate change through science and these causes need to be clearly established after full debates, validated comprehensively, before expensive remedies are imposed on industries and communities.
I first became interested in the question in the 1990s when studying the anti-human claims of the “deep greens”. Mine is not an appeal to the authority of any religious truth in the face of contrary scientific evidence. Neither is it even remotely tinged by a postmodernist hostility to rationality.
My appeal is to reason and evidence, and in my view the evidence is insufficient to achieve practical certainty on many of these scientific issues.
Recently Robert Manne, following fashionable opinion, wrote that “the science is truly settled” on the fundamental theory of climate change: global warming is happening; it is primarily caused by the emission of greenhouse gases, especially carbon dioxide; and it is certain to have profound effects in the future .
His appeal is to the “consensual view among qualified scientists”. This is a category error, scientifically and philosophically. In fact, it is also a cop-out, a way of avoiding the basic issues.
The basic issue is not whether the science is settled but whether the evidence and explanations are adequate in that paradigm.
I fear, too, that many politicians have never investigated the primary evidence.
Much is opaque to non-specialists, but persistent inquiry and study can produce useful clarifications, similar to the nine errors identified by the British High Court in Al Gore’s propaganda film, An Inconvenient Truth.
The complacent appeal to scientific consensus is simply one more appeal to authority, quite inappropriate in science or philosophy.
It is not generally realised that in 2001 at least, one of the Intergovernmental Panel on Climate Change Third Assessment Report’s working groups agreed: “In climate research and modelling, we are dealing with a coupled, non-linear, chaotic system, and therefore that the long-term prediction of future climate states is not possible.”
Claims of atmospheric warming often appear to conflict and depend upon the period of time under consideration.
► The earth has cooled during the past 10,000 years since the Holocene climate optimum.
► The earth has cooled since 1000 years ago, not yet achieving the temperatures of the Medieval Warm Period.
► The earth has warmed since 400 years ago after the Little Ice Age three centuries ago.
► The earth warmed between 1979 and 1998 and has cooled slightly since 2001.
The following facts are additional reasons for scepticism.
► In many places, most of the 11,700 years since the end of the last ice age were warmer than the present by up to 2C.
► Between 1695 and 1730, the temperature in England rose by 2.2C. That rapid warming, unparalleled since, occurred long before the Industrial Revolution.
► From 1976 to 2001, “the global warming rate was 0.16C per decade”, as it was from 1860 to 1880 and again from 1910 to 1940.
My suspicions have been deepened through the years by the climate movement’s totalitarian approach to opposing views. Those secure in their explanations do not need to be abusive.
The term “climate change denier”, however expedient as an insult or propaganda weapon, with its deliberate overtones of comparison with Holocaust denial, is not a useful description of any significant participant in the discussion. I was not surprised to learn that the IPCC used some of the world’s best advertising agencies to generate maximum effect among the public .
The rewards for proper environmental behaviour are uncertain, unlike the grim scenarios for the future as a result of human irresponsibility which have a dash of the apocalyptic about them.
The immense financial costs true believers would impose on economies can be compared with the sacrifices offered traditionally in religion, and the sale of carbon credits with the pre-Reformation practice of selling indulgences.
Some of those campaigning to save the planet are not merely zealous but zealots. To the religionless and spiritually rootless, mythology - whether comforting or discomforting - can be magnetically, even pathologically, attractive.
Whatever our political masters might decide at this high tide of Western indebtedness, they are increasingly unlikely, because of popular pressure, to impose new financial burdens on their populations in the hope of curbing the rise of global temperatures, except perhaps in Australia, which has 2 per cent of the world’s industrial capacity and only 1.2 per cent of its CO2 emissions, while continuing to sell coal and iron worth billions of dollars to Asia.
Extreme weather events are to be expected. This is why I support the views of Bjorn Lomborg and Bob Carter that money should be used to raise living standards and reduce vulnerability to catastrophes.
The cost of attempts to make global warming go away will be very heavy. They may be levied initially on “the big polluters” but they will eventually trickle down to the end-users. Efforts to offset the effects on the vulnerable are well intentioned but history tells us they can only be partially successful.
Sometimes the very learned and clever can be brilliantly foolish, especially when seized by an apparently good cause. My request is for common sense and what the medievals, following Aristotle, called prudence.
The appeal must be to the evidence. First of all we need adequate scientific explanations as a basis for our economic estimates. We also need history, philosophy, even theology and many will use, perhaps create, mythologies. But most importantly we need to distinguish which is which.
Cardinal George Pell is the Archbishop of Sydney. This is an edited extract of a speech
Read more here.
Wall Street Journal
Moving on from climate virtue.
The United Nations will convene its 17th annual climate-change conference next month in Durban, South Africa, with the purpose of sealing a new carbon-cutting deal to succeed the soon-to-expire 1997 Kyoto Protocol. It promises to be a historic event, if not in the way the organizers might hope.
The chances that a global deal on carbon would ever be reached were always slim, a point brought home by the collapse of the comic 2009 Copenhagen summit. But obituaries are sometimes late to print. Now, at last, the U.S., Russia and Japan have all said they won’t agree to any new binding carbon pact, while India and China were never believers in the first place.
That leaves the European Union, which until last month was “the only one still considering signing up in some fashion to a second commitment period,” according to Todd Stern, the Obama Administration’s climate negotiator. Even that’s no longer true. Last week, EU Climate Action Director General Jos Delbeke told reporters that “in reality what may happen is that the Europeans will pronounce themselves politically in favor of the Kyoto Protocol” but won’t lock themselves into any new anticarbon pacts unless “other parties join the club.” Regarding that likelihood, see above.
That isn’t the only reality check Europe is facing on the carbon front. In an internal memo first reported last week by Dow Jones Newswires, the European Commission’s energy department observed that “there is a trade-off between climate- change policies and competitiveness.” By the EU’s own estimate, the cost of meeting its current carbon emissions targets - a cut of at least 20% of 1990 emissions levels by 2020 - comes to at least 48 billion Euros ($67 billion) per year.
For a closer look at the price Europeans pay for their carbon virtue, consider Tata, Europe’s second-largest steelmaker. Last month the company warned that “EU carbon legislation threatens to impose huge additional costs on the steel industry,” citing this as one reason to close some of its U.K. operations and possibly cut some 1,200 jobs. Yet under the terms of Europe’s cap-and-trade scheme, Tata could be paid at least 20 million this year and next for those closures and layoffs.
Europe also seems to be getting wiser, if not yet wise, to the prohibitive costs of being green. In Britain, the government of David Cameron - which entered office last year promising to be the country’s “greenest government ever” - has scrapped plans for a carbon-capture-and-storage plant in Scotland, which was set to bust its £1 billion budget. “If there was a completely unlimited resource then we may have been able to surmount the technical problems,” Climate Change Secretary Chris Huhne told the BBC.
Then there are those “technical problems.” The process of capturing and compressing CO2 is energy-intensive. Storing the carbon once it’s been sequestered is another issue. In Germany, a 30-megawatt carbon-capture pilot plant has been in operation since 2008. Yet plant-operator Vattenfall must truck the sequestered CO2 more than 150 kilometers daily to store it in the nearest suitable locale. The company also recently suspended its plans for large-scale carbon capture and storage at Janschwalde in Germany. Environmental groups oppose putting carbon underground because they fear living above huge carbon sinks.
And so it goes with every technology that claims to promise greenhouse-gas salvation. Wind power may emit zero carbon, but windmills need up to 90% of their capacity backed up to prevent blackouts - usually with coal and gas plants. Windmills also kill a lot of birds. As for solar power, a new study from the University of Tennessee and Occupational Knowledge International finds that manufacturing the necessary lead batteries threatens to release more than 2.4 million tons of lead pollution by 2022, or one-third of today’s total global lead production.
The science on climate change and man’s influence on it is far from settled. The question today is whether it makes sense to combat a potential climate threat by imposing economically destructive regulations and sinking billions into failure-prone technologies that have their own environmental costs. The earnest people going to Durban next month may think so. The rest of the world is wearier and wiser.
GWPF from the WSJ
How to spend $157,000 per job.
The green jobs subsidy story gets more embarrassing by the day. Three years ago President Obama promised that by the end of the decade America would have five million green jobs, but so far some $90 billion in government spending has delivered very few.
A new report by the Labor Department’s Office of Inspector General examined a $500 million grant under the stimulus program to the Employment and Training Administration to “train and prepare individuals for careers in ‘green jobs.’” So far about $162.8 million has been spent. The program was supposed to train 125,000 workers, but only 53,000 have been “trained” so far, only 8,035 have found jobs, and only 1,033 were still in the job after six months.
Overall, “only 10% of participants entered employment.” In the understatement of the year, the IG says the program failed to “assist those most impacted by the recession.”
The jobs record is even more dismal when you consider that many of the jobs classified as green aren’t even new jobs, much less green, according to a report from the House Committee on Oversight and Government Reform. They include positions that have been “relabeled as green jobs by the BLS [Bureau of Labor Statistics].”
This means that bus drivers, Environmental Protection Agency regulators, university professors teaching ecology, and even the Washington lobbyists who secure energy loan guarantees count as green employees for the purposes of government counting. The Oversight Committee finds that even a charitable assessment of the Labor program puts the cost of each green job at $157,000.
The silver lining is that the IG found that as of “June 30, 2011, $327.3 million remained unexpended” from the Labor program’s appropriation. The IG urges that all funds “determined not to be needed should be recouped as soon as practicable and to the extent permitted by law.” That ought to be the deficit supercommittee’s first $327 million in savings.
A campaign to establish ecocide as the fifth international crime against peace appears to have gained further momentum following the first mock trial at the UK’s Supreme Court.
The campaign to make ecocide a crime is the brainchild of international lawyer Polly Higgins, who wants the UN to be able to brand companies that harm the environment as guilty of an offence comparable to genocide, war crimes or crimes against humanity.
The concept of ecocide has gradually secured more and more support since Higgins proposed it to the United Nations 18 months ago, but it was thrust into the spotlight last month when two fictional chief executives were found “guilty” of the offence at a mock trial on September 30.
UN issues call for green public-private partnerships
Figueres predicts carbon market will overcome current uncertaintyReal barristers led the case for and against the chief executives of two hypothetical firms, albeit ones that closely mirrored real companies responsible for a major oil spill in the Gulf of Mexico and unconventional tar sands extraction in Canada.
The jury eventually branded the Athabasca Tar Sands projects a crime, but returned a not guilty verdict for the charge of ecocide against the company responsible for the oil spill.
Speaking to BusinessGreen, Higgins hailed the trial as a success, adding that the not guilty verdict actually helped to boost the campaign, by demonstrating that showing that the mock trial followed realistic lines and was not a publicity stunt targeting firms that are guilty of environmental damage.
She also revealed that a number of countries including Australia, Brazil and Mexico are considering holding similar mock trials and that businesses are becoming increasingly engaged in the debate.
“This is very much positioned as a proposal that the business community really needs to wake up to,” she said. “The insurance industry is very engaged on this right now, we put out invites to oil and gas companies to the trial.”
She added that one oil company has since invited a lawyer at the trial to offer best practice advice on the prospective law.
She refused to reveal the names of the parties involved, but said it showed that businesses are increasingly realising that ecocide could be passed as a law.
“It’s going to be sooner rather than later [that ecocide will become a crime], because if we leave it too late we’ll all be toast,” she added.
If the law were passed, Higgins believes that businesses would need to shift their green strategies from “risk management” to addressing the potential legal consequences of environmental crimes.
“It’s no longer going to be about saying there’s a 0.01 per cent risk of something going wrong, its about saying that if it does go wrong, we’ll end up in prison, so we’re not going to do it,” she said.
Whether or not a chief executive really would end up in prison would depend on their culpability, said Ian Lawrie QC, who prepared the defence for the mock trial and acted as a hypothetical instructing solicitor.
He argued that if a director had been let down by an employee who they believed to be doing a good job, they might be deemed less responsible than if they knew about the mistakes being made.
Lawrie also revealed he is due to give a talk to a group of solicitors in the coming weeks, briefing them on the potential ecocide law. While he has not been directly approached by firms for advice, one of his existing clients has asked to be briefed on the outcome of the trial.
Jane Russell QC of Tooks Chambers, who was part of the trial’s prosecution team, urged firms to prepare for ecocide becoming law by ensuring they understand how to comply with the prospective law.
“I think if somebody is advising oil companies on best practice that’s great,” she said.
But despite the increased interest in the proposal, Higgins said she was unlikely to formalise the campaign for the new law. “So many people want to help make this happen, but I’m reluctant to start up a huge organisation,” she said. “I’m a lawyer, so I don’t want to manage people and organise a campaign.”
By Robert Krier
Once a fairly reliable harbinger of dry times in Southern California, the gal lost street cred last year. Her presence last fall was viewed with trepidation because we were in the midst of a drought. Another below-normal rainy season was feared and forecast.
Then the winter came, and so did the rains. A few days before Christmas, some of us had to drive through about a foot of that La Nina in flooded Mission Valley.
Up in Northern California, the rains kept coming and coming. Snow piled up high in the Sierra. In San Diego, the season ended with 12.62 inches of rain, well above the annual average of 10.34. Statewide, the drought was declared over, and La Nina was a laughingstock.
Was the rain last week a sign of more to come, or will she return to form and leave us high and dry this time?
We posed those questions to several meteorological experts, and their answers are found later in this story.
Take a look and then draw your own conclusions - because it will be your turn to make a forecast. It’s time for the 10th annual Union-Tribune Precipitation Prediction Contest.
Here’s how it works: Tell us how much rain you think will fall at Lindbergh Field, San Diego’s official weather station, between July 1 of this year and June 30, 2012. The winner will be the person who comes closest to the actual total, either over or under. Also, as a mandatory tiebreaker, list the calendar day that you think will be the wettest of the year.
Entries must be received by midnight Oct. 24.
The winner’s prize is nothing to sneeze at: four two-day adult ski lift tickets at Brian Head Resort in Utah and a two-night stay at the Cedar Breaks Lodge in Brian Head. Enter at SignOnSanDiego.com/RainContest or mail your entry to: Robert Krier, Precipitation Prediction Contest, The San Diego Union-Tribune, P.O. Box 120191, San Diego, CA 92112-0191.
What was up last year?
La Nina is a periodic atmospheric phenomenon marked by cooler-than-usual ocean temperatures in the central Pacific. Those cool waters usually help shift the storm track north, which typically leaves Southern California and the southern states drier than normal, and the Pacific Northwest wet.
Other than in Southern California, La Nina behaved as expected last year. Texas had a record drought, and the Northwest was soggy.
“California had some very unorthodox outcomes,” said Klaus Wolter, a climate researcher at the University of Colorado and for the National Oceanic and Atmospheric Administration’s Western Water Assessment team.
Wolter predicted last year that La Nina would return this winter. What he didn’t foresee was Southern California getting slammed last December by an “atmospheric river” of moisture thousands of miles long. Over Dec. 21 and 22, San Diego recorded 3.84 inches of rain.
The “atmospheric river” phenomenon is impossible to predict more than two weeks in advance. If one hits a normally dry place like San Diego, it skews the numbers. January to March was drier than usual; take away those two days in December and the season total is well below normal.
This year? Wolter is going low again. “I would be very surprised if you had a wet year,” Wolter said. “Ten inches? Good luck with that.”
Long-range forecasters stress that the presence of La Nina doesn’t guarantee anything, but it’s like playing with loaded dice. Rigged dice can be made to come up seven more often the normal odds, but that doesn’t mean seven will appear every roll.
“The thing we have to realize is that it kind of shifts the likelihood of something happening,” said Mike Halpert, deputy director of the Climate Prediction Center in Maryland. “This year, there’s a slight tilt (toward dry) in your area, but it’s a very slight tilt.”
Those at the center have yet to figure out why the La Nina tilt last year, which was far stronger than this year’s episode, didn’t deliver a dry winter in Southern California, Halpert said. “To put it in terms you can use in the newspaper, stuff happens,” Halpert said. Halpert’s prediction for San Diego this year: 9.2 inches. “But I’m never right,” he added.
Wannabe La Nina?
Bill Patzert of the Jet Propulsion Lab in Pasadena said La Nina this year is a wannabe, compared to last year’s. “The signal in the ocean is puny,” he said. Other global-scale atmospheric patterns, such as one called the Arctic Oscillation (based on pressure and temperature differences in the Arctic), could override La Nina and make it play second fiddle. That’s what happened last year, Patzert believes. A strong, long-lasting negative phase of the Arctic Oscillation helped lock the West Coast into a trough pattern that brought a series of powerful storms, especially those in December.
But it’s impossible to know if the oscillation will repeat last year’s performance. Like those atmospheric rivers, its phases can’t be predicted more than a couple of weeks out.
Patzert thinks La Nina will reassert itself this year. His prediction: 8.18 inches, but he is not confident. “My prediction is a (guess),” he said. “There’s just not enough information right now to sound too prophetic.”
The lone meteorologist consulted for this story who expects above-normal rainfall in San Diego this year is Ivory Small, science officer at the National Weather Service’s office in Rancho Bernardo.
Last year, a general trough pattern on the West Coast in the spring and summer led him to a “persistence” forecast. He thought the condition would continue into the rainy season, so he predicted normal rainfall. This year, with similar conditions present, Small is predicting an inch above normal: 11.34 inches. “I may be the lone dog hanging out there just to be challenging,” Small said.
H/T John Coleman